Welcome to Leaspy’s documentation!
LEArning Spatiotemporal Patterns in Python
Description
Leaspy is a software package for the statistical analysis of longitudinal data, particularly medical data that comes in a form of repeated observations of patients at different time-points.
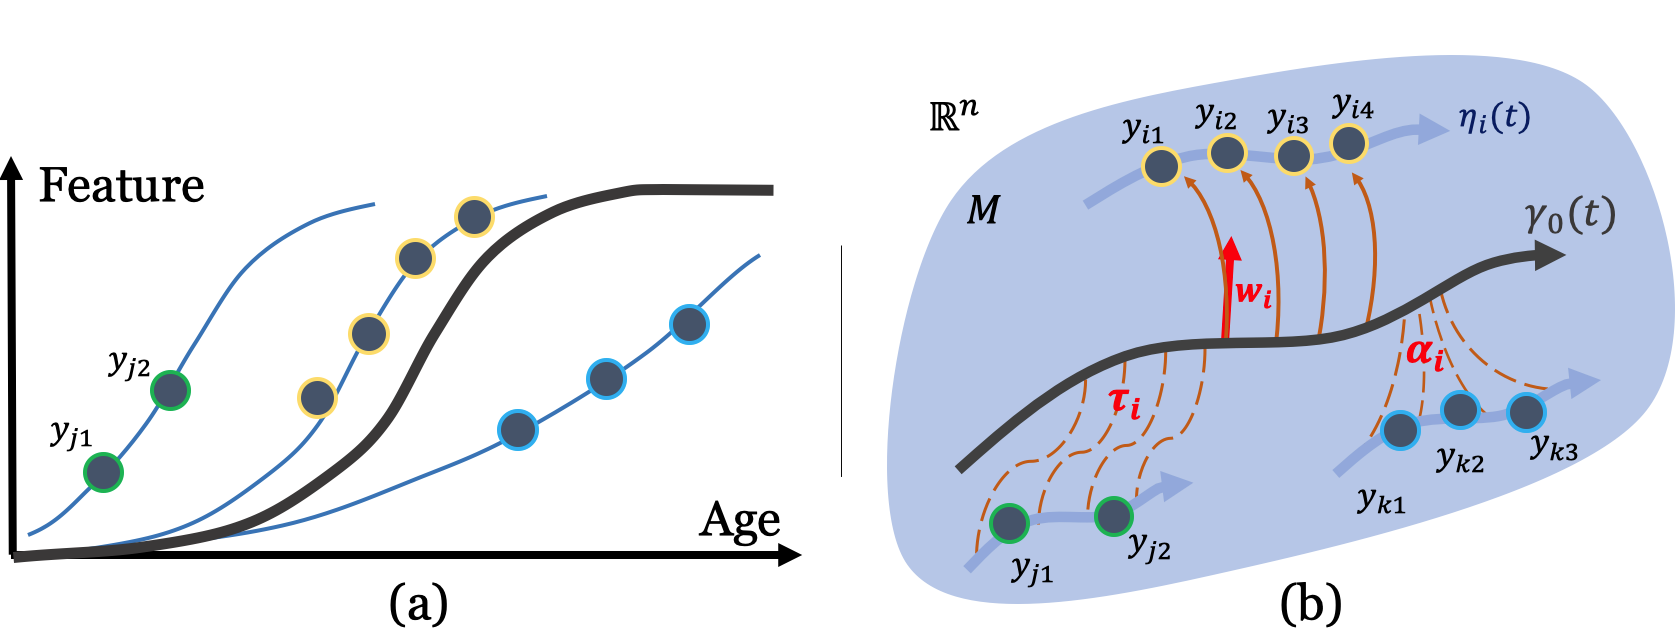
Recombining them to reconstruct the long-term spatio-temporal trajectory of evolution
Positioning each patient observations relatively to the group-average timeline, in term of both temporal differences (time shift and acceleration factor) and spatial differences (different sequences of events, spatial pattern of progression, …)
Quantifying impact of cofactors (gender, genetic mutation, environmental factors, …) on the evolution of the signal
Imputing missing values
Predicting future observations
Simulating virtual patients to un-bias the initial cohort or mimic its characteristics
The software package can be used with scalar multivariate data whose progression can be modelled by a logistic shape, an exponential decay or a linear progression. The simplest type of data handled by the software are scalar data: they correspond to one (univariate) or multiple (multivariate) measurement(s) per patient observation. This includes, for instance, clinical scores, cognitive assessments, physiological measurements (e.g. blood markers, radioactive markers) but also imaging-derived data that are rescaled, for instance, between 0 and 1 to describe a logistic progression.
Getting started
Information to install, test, and contribute to the package.
API Documentation
The exact API of all functions and classes, as given in the docstrings. The API documents expected types and allowed features for all functions, and all parameters available for the algorithms.
User Guide
The main documentation. This contains an in-depth description of all algorithms and how to apply them.
License
The package is distributed under the BSD 3-Clause license.
Further information
More detailed explanations about the models themselves and about the estimation procedure can be found in the following articles :
Mathematical framework: A Bayesian mixed-effects model to learn trajectories of changes from repeated manifold-valued observations. Jean-Baptiste Schiratti, Stéphanie Allassonnière, Olivier Colliot, and Stanley Durrleman. The Journal of Machine Learning Research, 18:1–33, December 2017. Open Access
Application to imaging data: Statistical learning of spatiotemporal patterns from longitudinal manifold-valued networks. I. Koval, J.-B. Schiratti, A. Routier, M. Bacci, O. Colliot, S. Allassonnière and S. Durrleman. MICCAI, September 2017. Open Access
Application to imaging data: Spatiotemporal Propagation of the Cortical Atrophy: Population and Individual Patterns. Igor Koval, Jean-Baptiste Schiratti, Alexandre Routier, Michael Bacci, Olivier Colliot, Stéphanie Allassonnière, and Stanley Durrleman. Front Neurol. 2018 May 4;9:235. Open Access
Application to data with missing values: Learning disease progression models with longitudinal data and missing values. R. Couronne, M. Vidailhet, JC. Corvol, S. Lehéricy, S. Durrleman. ISBI, April 2019. Open Access
Intensive application for Alzheimer’s Disease progression: AD Course Map charts Alzheimer’s disease progression, I. Koval, A. Bone, M. Louis, S. Bottani, A. Marcoux, J. Samper-Gonzalez, N. Burgos, B. Charlier, A. Bertrand, S. Epelbaum, O. Colliot, S. Allassonniere & S. Durrleman, Scientific Reports, 2021. 11(1):1-16 Open Access
www.digital-brain.org : Website related to the application of the model for Alzheimer’s disease.
Disease Course Mapping webpage by Igor Koval